A short intro to causal models and DAGs

2025-07-29
Causal Models
Causal Models as Directed Acyclic Graphs
(McElreath chapter 5; hint: helpful for assignment)
A DAG can show the causal associations in the model you are building.
It helps answer the question, What are the elements that matter in understanding the inference and potential confounding factors?
Correlations
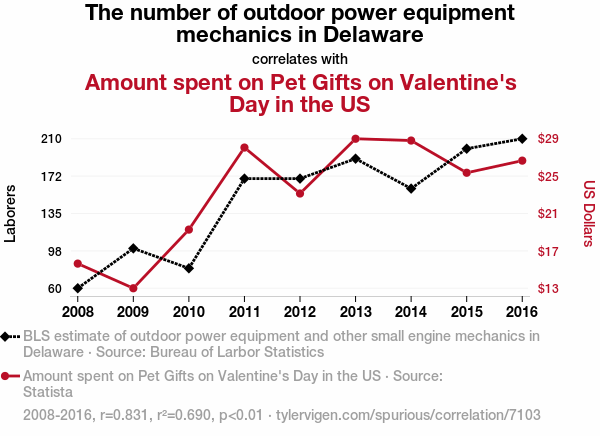
A DAG
- The DAG forces us to be explicit about our theory about how the phenomenon comes to be.
- There are testable implications of the causal graph.
- For example, are two variables associated? (presumably Yes, if they are connected).
- Are two variables independent? We can look at simple correlations to check this.
Benefits of Causal Modeling
Is there any additional value in knowing a variable, once I already know all of the other predictor variables?
This might help us identify when we are collecting useless extra data.
If we look at the model in Statistical Rethinking, 5.1.3, we see how we build a model to check the ways in which two variables, or factors, influence the model.
Causal Workflow
The point of causal modeling is to create a model outside of statistics to describe what we think is happening in our research world.
It is about causation, i.e., we specifically want to see if some intervention is bringing about a change in the predicted variable.
If we don’t care about causation then this model wouldn’t apply. But note in my experience that is usually the type of question data science is curious about.
Example: Does Sentiment in Comments Affect Prioritization
Does expressing negative sentiments in code comments affect prioritization of those comments? 1
// USED ONLY FOR REGRESSION TESTING!!!! todo: obviously get rid of all this junk
// Used only for regression testing! todo: clearly remove all this unnecessary code
Exercise
With your project team, draw a DAG expressing causality in this experiment.
- what are the important constructs (nodes)?
- what influence do constructs have on each other (arrows)?
- what is the ‘dependent’ node(s)?
One Solution
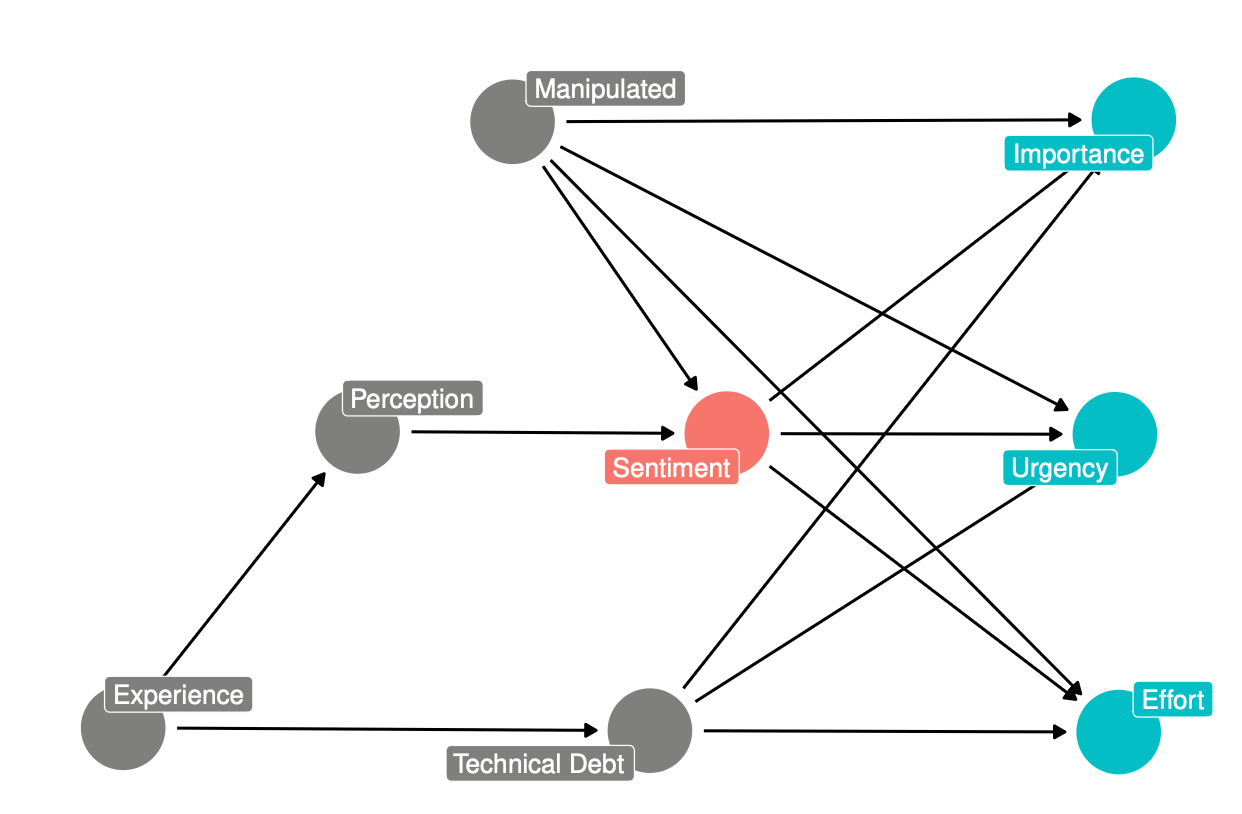
Example
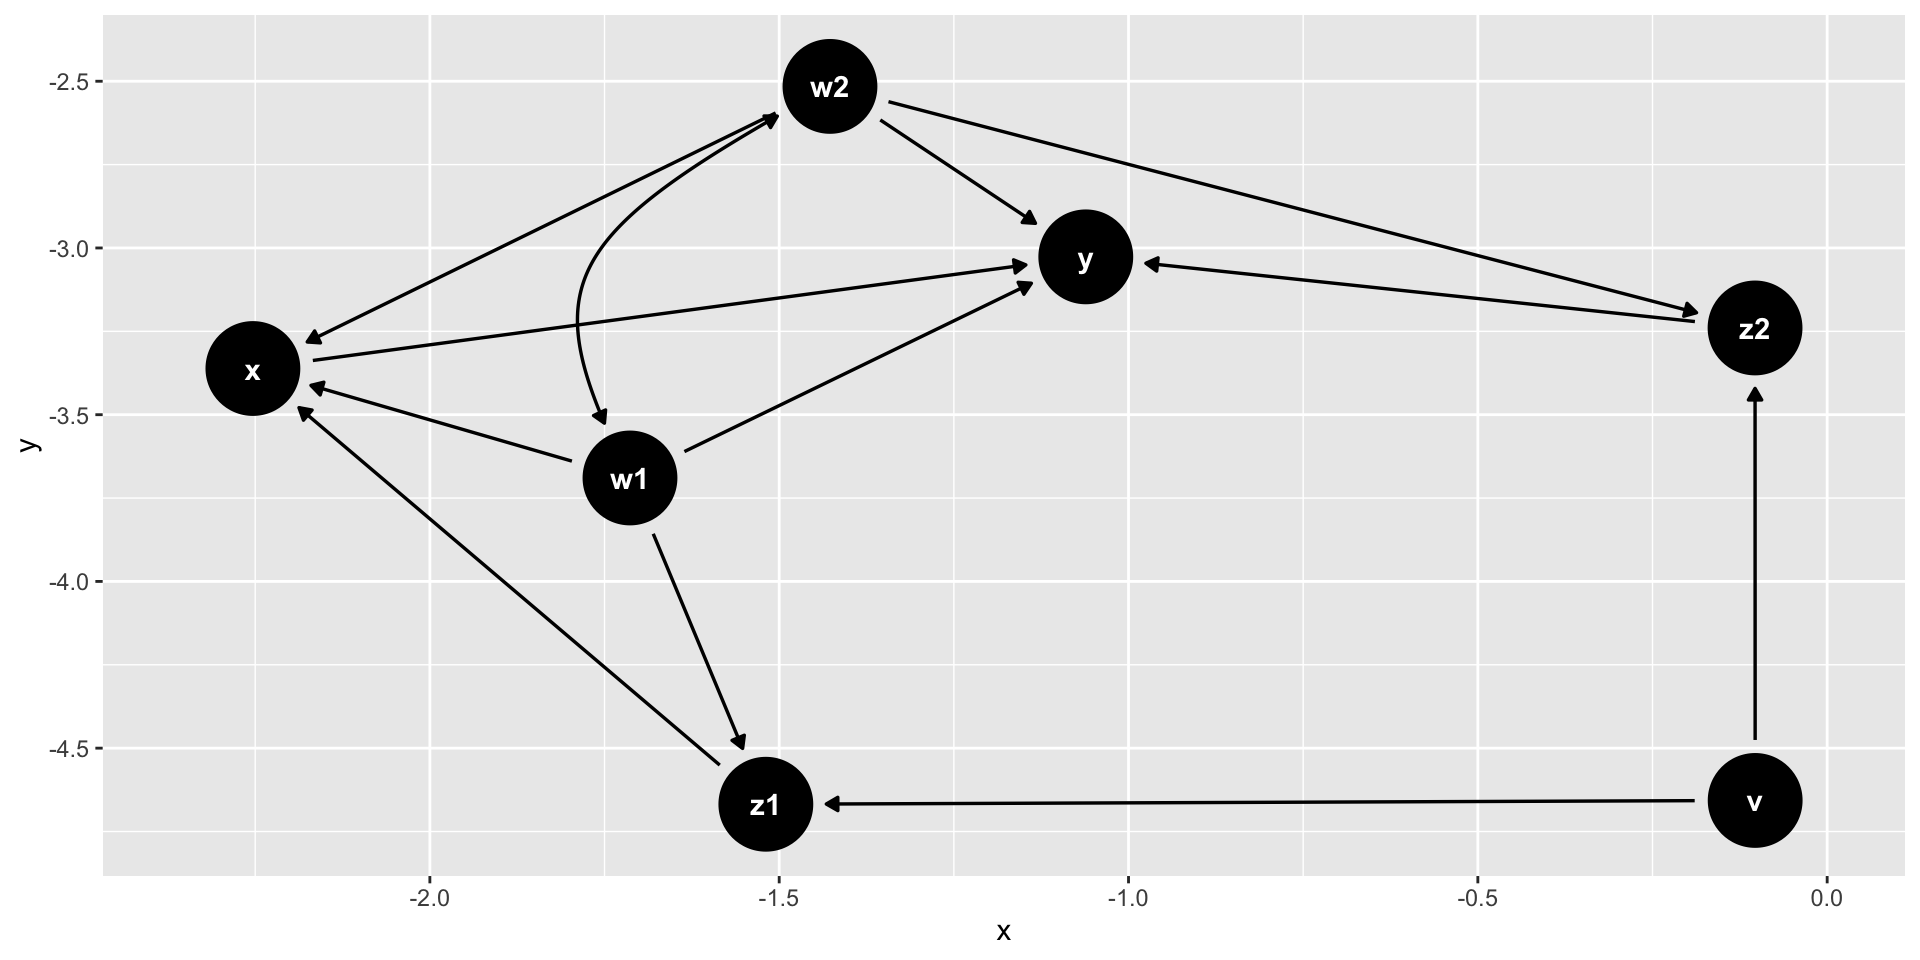
(reference: github.com/r-causal/ggdag)
Example
And Now What?
- refines our thinking about what we are studying (the theory)
- allows for causal reasoning (eg. the do-calculus)
- typically we cannot run RCTs on a lot of questions. We can’t expose some people to possibly toxic substances.
- causal reasoning provides a framework for identifying true causality (as opposed to correlation).
Extra
Causal Workflow: paths
- Identify the data we have collected or will collect (lines of code, complexity, hours worked, etc). Since the universe is itself causal, we clearly cannot collect data on everything.
- Consider unobserved (latent) variables - we won’t or cannot measure it (e.g. for privacy reasons), but we need to account for it.
- Decompose the DAG into three elemental paths: forks (\(X \leftarrow Z \rightarrow Y\)) pipes (\(X \rightarrow Z \rightarrow Y\)) and colliders (\(X \rightarrow Z \leftarrow Y\))
Pipes
- If ignore Z, then X and Y are associated. Stratify by Z, X and Y not associated. All of the information about X comes to Y through Z. No additional information about X if we know Z.
Forks
- Same structure as pipes. X and Y are associated because they both have information only from Z. Once you learn Z, learning X doesn’t give more data on Y.
- Need more data to distinguish forks from pipes.
Collider
- Ignore Z, X and Y NOT associated. Stratify by Z, X and Y are associated.
- X and Y are independent causes of Z.
- X and Y have mutual information: learning X tells me something about Y

Neil Ernst ©️ 2024-5